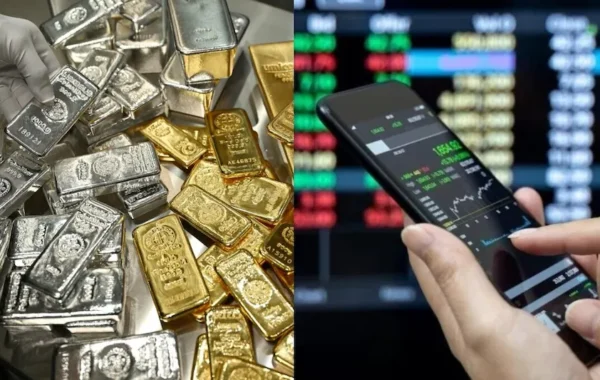
The gold and silver market continues to draw significant attention from investors and analysts alike. Here’s a comprehensive look at the latest developments and what they could mean for your portfolio.
Key Highlights
In April 2020, GoldSilver published this explanation of wealth cycles from Mike Maloney — drawn from his 2018 “Early Warning” presentation — and it became one of the most-watched videos on our channel. The core idea hasn’t aged a day. Most investors watch prices. Mike Maloney watches value — and the gap between those two things is the foundation of his entire investment philosophy.
In this video, Mike breaks down the recurring rotation of capital between asset classes that has played out for over a century. You don’t need perfect timing to use it. You just need to know how to measure what you own.
.wc-stats { font-family: ‘Instrument Sans’, -apple-system, BlinkMacSystemFont, ‘Segoe UI’, sans-serif; display: flex; flex-direction: column; gap: 10px; max-width: 780px; margin: 32px auto; } .wc-stats__item { background: #052D6B; border-radius: 6px; padding: 18px 22px; } .wc-stats__num { display: block; font-size: 2rem; font-weight: 700; color: #FCB817; line-height: 1.1; margin-bottom: 4px; } .wc-stats__label { display: block; font-size: 0.9rem; color: #ffffff; opacity: 0.9; line-height: 1.4; } 3× Times the Dow/gold cycle has repeated since 1900 150 oz Gold value of a house — the same in 1920 and 2011 1:1 Dow-to-gold ratio target at cycle extremes
Why Doesn’t an Underperforming Asset Actually Fall in Price?
This is one of the most counterintuitive points in Mike’s framework. When investors pile into one asset class, the ones they’re abandoning don’t necessarily drop — they drift sideways, or inch upward. The reason is constant currency creation. New money flows into every corner of the economy, propping up even neglected assets in nominal terms. Mike Maloney has written about this dynamic extensively — it’s the core reason why comparing asset prices in dollar terms alone is misleading.
The result is a persistent illusion: an asset can appear stable while quietly losing real purchasing power. Price goes up. Value stagnates. Most investors never notice the difference.
Key distinction: Price is the nominal dollar figure assigned to an asset. Value is what that asset can actually purchase relative to other assets. In a system of continuous currency creation, price is always rising — but value reveals who is actually winning.
How Do You Measure Whether an Asset Is Truly Overvalued or Undervalued?
Mike Maloney’s method is simple: divide one asset class by another. Take the Dow Jones Industrial Average and divide it by the price of gold. Instantly, you strip out dollar inflation and see which asset is genuinely expensive — and which is cheap. Run the same calculation in reverse and overlay both charts. A clear, repeating cycle appears: stocks surge, then gold surges, then stocks again.
According to Mike, that cycle has played out roughly three times since 1900. The Dow-to-gold ratio chart [GoldSilver.com] makes this visible in a single view — and we’re still moving through the current cycle.
Get Expert Insights from Alan Hibbard Learn from Alan Hibbard, a trusted voice in precious metals delivering clear, actionable analysis on gold, silver and the global economy.
hbspt.forms.create({ portalId: “49485195”, formId: “7efcf96f-8238-4e19-a9ad-cae3c55d6248”, region: “na1″ }); /* === Mike & Alan CTA – Dark Theme Wrapper === */ .mike-alan-cta { background: linear-gradient(135deg, #052d6b 0%, #041f4d 100%); border-radius: 12px; padding: 20px; margin: 20px auto; box-shadow: 0 8px 16px rgba(0,0,0,0.2); max-width: 1200px; } /* Top section – Image + Text side by side */ .mike-alan-cta-top { display: flex; align-items: center; gap: 20px; margin-bottom: 24px; } /* Image section */ .mike-alan-cta-image { flex: 0 0 25%; max-width: 250px; } .mike-alan-cta-image img { width: 100%; height: auto; display: block; border-radius: 8px; } /* Text section */ .mike-alan-cta-text { flex: 1 1 75%; } /* Heading */ .mike-alan-cta h2 { color: #ffffff; font-size: 18px; font-weight: 400; margin: 0; line-height: 1.4; text-align: left; } .mike-alan-cta h2 span { color: #fcb817; font-size: 28px; font-weight: 700; line-height: 1.3; display: block; margin-bottom: 12px; } /* Form wrapper – Full width below */ .mike-alan-cta .mike-alan-cta-form-wrap { background: rgba(255,255,255,0.1); padding: 8px; border-radius: 8px; width: 100%; } /* HubSpot form container */ .mike-alan-cta .hubspot-form-container { min-height: 50px; } /* === FORM LAYOUT === */ .mike-alan-cta .hbspt-form form.hs-form { display: flex !important; align-items: flex-start; gap: 12px; flex-wrap: nowrap; } /* Remove HubSpot stacked spacing */ .mike-alan-cta .hbspt-form .hs-form-field, .mike-alan-cta .hbspt-form .hs_email, .mike-alan-cta .hbspt-form .hs_submit { margin: 0 !important; } /* === EMAIL FIELD === */ /* Hide default label */ .mike-alan-cta .hbspt-form .hs_email label { display: none !important; } /* Make the email field expand */ .mike-alan-cta .hbspt-form .hs_email { flex: 1 1 auto; } /* Input wrapper reset */ .mike-alan-cta .hbspt-form .hs_email .input { margin: 0 !important; } /* Input styling */ .mike-alan-cta .hbspt-form input.hs-input[type=”email”] { width: 100%; height: 48px; border-radius: 6px; border: none; padding: 0 16px !important; font-size: 16px; box-shadow: 0 0 0 1px rgba(0,0,0,0.08); outline: none; } .mike-alan-cta .hbspt-form input.hs-input[type=”email”]:focus { box-shadow: 0 0 0 2px rgba(252, 184, 23, 0.5); } /* === SUBMIT BUTTON === */ .mike-alan-cta .hbspt-form .hs_submit .hs-button { height: 48px; border-radius: 6px !important; padding: 0 32px !important; border: none !important; background: #2baa57 !important; color: #fff !important; font-size: 16px !important; font-weight: 600 !important; cursor: pointer; white-space: nowrap; text-transform: uppercase; } .mike-alan-cta .hbspt-form .hs_submit .hs-button:hover { background: #238f47 !important; } /* Make HubSpot thank-you message text white */ .mike-alan-cta .hbspt-form .submitted-message { color: #ffffff !important; text-align: center; } .mike-alan-cta .hbspt-form .submitted-message a { color: #fcb817 !important; } .mike-alan-cta .hbspt-form .submitted-message span { color: #ffffff !important; font-size: 18px; text-align: center; display: block; } /* Error messages */ .mike-alan-cta .hbspt-form .hs-error-msgs { list-style: none; padding: 0; margin: 4px 0 0 0; } .mike-alan-cta .hbspt-form .hs-error-msg { color: #ffcccc; font-size: 14px; } /* === TABLET RESPONSIVE === */ @media (max-width: 900px) { .mike-alan-cta { padding: 25px; } .mike-alan-cta-top { gap: 20px; margin-bottom: 20px; } .mike-alan-cta-image { flex: 0 0 30%; max-width: 300px; } .mike-alan-cta h2 { font-size: 18px; } .mike-alan-cta h2 span { font-size: 24px; } } /* === MOBILE RESPONSIVE === */ @media (max-width: 600px) { .mike-alan-cta { padding: 20px; } .mike-alan-cta-top { flex-direction: column; text-align: center; gap: 20px; margin-bottom: 20px; } .mike-alan-cta-image { max-width: 300px; margin: 0 auto; flex: 0 0 auto; } .mike-alan-cta h2 { text-align: center; font-size: 17px; } .mike-alan-cta h2 span { font-size: 22px; margin-bottom: 10px; } .mike-alan-cta .hbspt-form form.hs-form { flex-wrap: wrap; } .mike-alan-cta .hbspt-form .hs_submit { width: 100%; } .mike-alan-cta .hbspt-form .hs_submit .hs-button { width: 100%; text-align: center; } } What Does a House Actually Cost When You Measure It in Gold?
The most striking example in the video tracks a single home across a century. In the 1920s, a four-bedroom house with a pool sold for $3,000 — or 150 ounces of gold, at the then-fixed US price of $20.67 per ounce. [Macrotrends, Historical Gold Prices]
By 2011, that same house had climbed to $300,000 in dollar terms. Gold peaked at $1,925 per ounce that September. [Macrotrends, Historical Gold Prices] Measured in gold, the house was still worth roughly 150 ounces. The nominal price multiplied by 100. The real value went nowhere.
That’s what Mike calls the valuation channel: assets oscillate within a measurable range even as their dollar prices climb for decades. His theoretical illustration shows that an investor who rotated between real estate and gold at each major cycle turn — selling the overvalued asset, buying the undervalued one — could have converted that one home into 160 equivalent properties. Not a prediction, but a demonstration of the concept’s compounding power across multiple cycles.
Why Do Precious Metals Play a Role in the Wealth Cycle?
Gold and silver aren’t just commodities in Mike’s framework — they’re money. That distinction matters. When other commodities weaken, precious metals can still rise, because investors treat them as safe havens during crises. That dual nature — commodity and monetary asset simultaneously — makes them the most reliable measuring stick for comparing real value across asset classes over time.
They also tend to be undervalued precisely when stocks are peaking, and overvalued when stocks are bottoming. That’s not coincidence. It’s the cycle functioning as designed — and it’s why Mike returns to gold as his baseline for nearly every valuation comparison he makes. The Hidden Secrets of Money series covers this relationship in full historical detail.
Do You Need to Time the Market Perfectly to Benefit from Wealth Cycles?
No — and Mike makes this explicit. The examples in this video represent theoretical maximum gains from perfect timing across multiple generations. No real investor achieves that. But catching even one major rotation — moving out of an overvalued asset class into an undervalued one — can produce results that a single-asset buy-and-hold strategy cannot match.
The goal isn’t perfection. It’s escaping the valuation channel: the slow trap of staying in one asset through your entire investing life and arriving, in real terms, close to where you started. As Mike demonstrates using the Dow, an investor who bought stocks in 1929 and held for 89 years could only buy 19 ounces of gold with the proceeds — versus the 818 ounces it cost to enter that position. [Macrotrends, Dow Jones Historical Chart]
.modern-card { background: #ffffff; border-radius: 12px; border: 1px solid #052d6b; box-shadow: 0 2px 8px rgba(5, 45, 107, 0.08); padding: 20px; width: 100%; margin: 20px auto; transition: transform 0.2s ease, box-shadow 0.2s ease; text-align: center; } .modern-card:hover { transform: translateY(-2px); box-shadow: 0 4px 12px rgba(5, 45, 107, 0.12); } .modern-card-title { color: #052d6b; font-size: 30px; font-weight: 600; margin-bottom: 15px; line-height: 1.3; margin-top: 0; } .modern-card-description { color: #64748b; font-size: 15px; line-height: 1.6; margin-bottom: 24px; } .cta-container { display: flex; gap: 12px; justify-content: center; margin-top: 12px; } .cta-price-wrapper { flex: 0 0 60%; max-width: 60%; } .cta-button-wrapper { flex: 0 0 calc(40% – 12px); max-width: calc(40% – 12px); } #cta-price { width: 100%; height: 70px; min-height: 70px; } .hs-cta-embed { max-width: 100% !important; width: 100% !important; height: 70px !important; min-height: 70px !important; margin: 0 !important; padding-top: 13px; } } .hs-cta-embed a { height: 70px !important; min-height: 70px !important; } .hs-cta-embed img { height: 70px !important; min-height: 70px !important; } /* Responsive */ @media (max-width: 768px) { .modern-card { padding: 15px 10px 5px 10px; } .modern-card-title { font-size: 20px; line-height:30px; margin-bottom:0px; } .cta-container { flex-direction: column; gap: 10px; } .cta-price-wrapper, .cta-button-wrapper { flex: 0 0 100%; max-width: 100%; } .hs-cta-embed { padding-top: 5px; } }
Investing in Physical Metals Made Easy
(function(){ var t = document.getElementsByTagName(‘script’)[0]; var s = document.createElement(‘script’); s.async = true; s.src = ‘https://widget.nfusionsolutions.com/widget/script/ticker/1/ca5cd305-1d29-4399-94c0-e50cc5d6f780/6613c4d7-d552-40f5-b5c8-02d5607a400d/cta-price?symbols=gold,silver,gold/silver¤cy=usd&unitofmeasure=toz’; t.parentNode.insertBefore(s, t); })(); People Also Ask What is a wealth cycle?
A wealth cycle is the recurring rotation of investment capital between major asset classes — stocks, real estate, and commodities including precious metals. As one asset class becomes overvalued, capital shifts toward undervalued alternatives, creating measurable cycles of relative performance that repeat over decades. Mike Maloney, founder of GoldSilver.com, has tracked this pattern back to at least 1900 using the Dow-to-gold ratio.
How does Mike Maloney define value vs. price?
Price is the nominal dollar amount assigned to an asset. Value is what that asset can actually purchase relative to other assets. Mike argues that price is systematically distorted by currency creation — new money inflates all asset prices simultaneously — while value, measured by dividing one asset class by another, reveals which assets are genuinely cheap or expensive at any given moment.
What is the Dow-to-gold ratio?
The Dow-to-gold ratio divides the current price of the Dow Jones Industrial Average by the current price of one ounce of gold. The result shows how many ounces of gold it takes to buy one “share” of the Dow, stripping out dollar inflation entirely. When the ratio is high, stocks are expensive relative to gold. When it’s low, gold is expensive relative to stocks. Mike Maloney uses this ratio as a core analytical tool in wealth cycle analysis. View the live ratio chart at GoldSilver.com.
Why is gold used as the measuring stick for value?
Gold has functioned as money across thousands of years and multiple civilizations, and its supply grows slowly relative to other assets. Unlike the dollar, gold cannot be created by a central bank. That scarcity and monetary history make it a stable benchmark for comparing the real purchasing power of stocks, real estate, and other assets over long time horizons.
When does the current wealth cycle end?
Mike Maloney has said publicly that the cycle’s precise end point is uncertain. His framework suggests the cycle concludes when gold becomes historically overvalued relative to stocks and real estate — meaning the Dow-to-gold ratio reaches a low extreme, historically somewhere between 1:1 and 5:1. He views that endpoint as one of the most significant wealth-building opportunities in modern history, while consistently cautioning that exact timing is neither necessary nor realistic for most investors.
SOURCES 1. Mike Maloney, Early Warning presentation, GoldSilver.com, 2018. Published April 18, 2020. youtube.com/watch?v=l-knwwD-PZc 2. Historical Gold Prices — 100 Year Chart, Macrotrends. macrotrends.net 3. Dow Jones — 100 Year Historical Chart, Macrotrends. macrotrends.net 4. Dow-to-Gold Ratio Chart, GoldSilver.com. goldsilver.com/price-charts/gold-silver-ratio/ 5. Guide to Investing in Gold and Silver, Mike Maloney, GoldSilver.com. goldsilver.com 6. Hidden Secrets of Money, Mike Maloney, GoldSilver.com. goldsilver.com 7. Gold Reserve Act of 1934, Federal Reserve History. federalreservehistory.org
Disclaimer: This article is for informational purposes only and does not constitute investment advice. Past performance is not indicative of future results. Always consult a qualified financial advisor before making investment decisions.
You May Also Like:
- Gold and Silver Mining Stocks: What Most Investors Miss
- Is There a Silver Shortage in 2026? The Data Is Alarming
- The Seven Stages of Empire: Why Every Great Currency Eventually Collapses
- When Should You Sell Gold and Silver? (And What to Buy Next)
- Could the US Revalue Its Gold Reserves to Pay Down Debt?
- How Gold Performs in Recessions: What History Tells Us
- Gold vs Inflation: What 100 Years of Data Shows
The post What Is a Wealth Cycle? Price vs. Value Explained appeared first on GoldSilver.
What This Means for Investors
For those tracking precious metal markets, this development is particularly important. Gold and silver have historically served as safe-haven assets during times of economic uncertainty. Keeping an eye on these trends can help you make more informed investment decisions.
Final Thoughts
Staying informed about gold and silver price movements is crucial for both traders and long-term investors. We recommend checking our live gold price page for real-time updates and setting up price alerts to never miss a major movement.