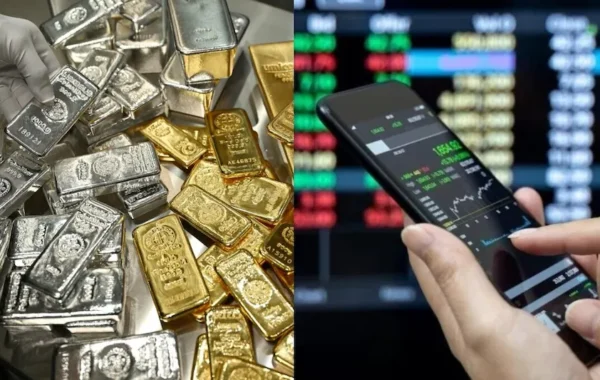
The gold and silver market continues to draw significant attention from investors and analysts alike. Here’s a comprehensive look at the latest developments and what they could mean for your portfolio.
Key Highlights
Morning News Nuggets | Today’s top stories for gold and silver investors March 31st, 2026 | Brandon Sauerwein, Editor
Gold prices and inflation in 2026 are being shaped by a single pressure point: the Middle East conflict and what it means for energy, commodities, and Fed policy. Here’s what moved markets in March.
Why Are Gas Prices Surging — and How High Could They Go?
Gas prices are hitting American wallets hard. The national average jumped 27 cents in a single week — from about $3.00 to $3.48 per gallon — as oil deliveries stalled in the Persian Gulf. That’s not a gradual climb. That’s a shock.
California is the clear outlier. The state is averaging $5.34 per gallon, more than $1.75 above the national average. At the other end, Kansas sits at $3.01. The $2.33 gap between them captures just how differently this crisis lands depending on where you live.
The pressure starts upstream. Brent crude was trading around $111 per barrel as of March 30 — nearly $38 higher than a year ago. Crude is still the largest single cost built into every gallon at the pump.
Petroleum analysts have called current conditions “uncharted territory.” And the timeline for relief isn’t clear. When oil spikes, gas prices follow fast. When oil falls, prices ease slowly — a dynamic traders call “rockets and feathers.” Until the Strait of Hormuz reopens, the rocket is still in the air.
Why Is Gold Down 14% in March — and Is the Selloff Overdone?
Gold is on track for its worst month since October 2008 — down roughly 14% in March. The culprit isn’t weak demand. It’s a rate cut story that unraveled fast.
Before the Middle East conflict escalated, markets were pricing in two Fed cuts this year. That expectation is largely gone. Surging crude oil has reignited inflation pressure, and the Fed held rates steady at 3.50–3.75% at its March meeting. When rate cuts get pushed out, the opportunity cost of holding gold rises. The selloff follows the logic.
Silver, platinum, and palladium each dropped around 20% this month — a broad retreat across precious metals, not just gold.
The picture gets more interesting from here. Gold edged higher Tuesday after reports that President Trump may be open to ending the U.S. military campaign against Iran. That’s a short-term move. The longer-term case hasn’t changed. Goldman Sachs still targets $5,400 per ounce by year-end, citing central bank diversification and eventual Fed easing. At current prices, that’s a significant gap between where gold is and where one major bank thinks it’s going.
Why Is Aluminum Up 10% This Month — and What Does It Mean for Prices?
Gold and oil are dominating the conflict headlines. Aluminum is quietly having its best month in nearly two years.
Three-month futures on the London Metal Exchange are up roughly 10% in March — the biggest monthly gain since April 2024. The driver is geography. The Persian Gulf accounts for about 9% of global aluminum output. The Strait of Hormuz closure has effectively cut that supply off.
The damage is getting specific. Iranian strikes hit facilities belonging to Bahrain Aluminum and Emirates Global Aluminum. One Natixis analyst warned that if the damage proves lasting, the global aluminum market could swing from a surplus of 200,000 tons to a shortage of 1.3 million tons.
That’s not an abstraction. Aluminum flows into building materials, cars, and packaging. Price increases here don’t stay in the commodities market — they show up in construction costs, on dealership lots, and on store shelves. Copper, zinc, and nickel are all down in March. Aluminum is the exception. When a single metal breaks from the pack during a broad selloff, it’s usually worth asking why.
/* === CTA 1 – Dark Theme Wrapper === */ .free-guide-cta1 { background: linear-gradient(135deg, #052d6b 0%, #041f4d 100%); border-radius: 12px; padding: 30px; margin: 20px auto; box-shadow: 0 8px 16px rgba(0,0,0,0.2); max-width: 1200px; } /* Main flex container for image + content */ .free-guide-cta1-container { display: flex; align-items: center; gap: 30px; } /* Book image section */ .free-guide-cta1-image { flex: 0 0 auto; max-width: 180px; } .free-guide-cta1-image img { width: 100%; height: auto; display: block; border-radius: 8px; box-shadow: 0 4px 12px rgba(0,0,0,0.3); } /* Content section */ .free-guide-cta1-content { flex: 1 1 auto; } /* Heading */ .free-guide-cta1 h2 { color: #ffffff; font-size: 23px; font-weight: 700; margin: 0 0 20px 0; line-height: 1.3; text-align: left; } .free-guide-cta1 h2 span { color: #fdb913; font-size: 30px; line-height: 1.3; display: block; margin-bottom: 8px; } /* Inner form container */ .free-guide-cta1 .free-guide-cta1-form-wrap { background: rgba(255,255,255,0.1); padding: 8px; border-radius: 8px; color: #fff; } /* === FORM LAYOUT === */ .free-guide-cta1 .hbspt-form form.hs-form { display: flex !important; align-items: center; gap: 12px; flex-wrap: nowrap; } /* Remove HubSpot stacked spacing */ .free-guide-cta1 .hbspt-form .hs-form-field, .free-guide-cta1 .hbspt-form .hs_email, .free-guide-cta1 .hbspt-form .hs_submit { margin: 0 !important; } /* === EMAIL FIELD === */ /* Hide default label */ .free-guide-cta1 .hbspt-form .hs_email label { display: none !important; } /* Make the email field expand */ .free-guide-cta1 .hbspt-form .hs_email { flex: 1 1 auto; } /* Input wrapper reset */ .free-guide-cta1 .hbspt-form .hs_email .input { margin: 0 !important; } /* Input styling */ .free-guide-cta1 .hbspt-form input.hs-input[type=”email”] { width: 100%; height: 48px; border-radius: 6px; border: none; padding: 0 16px !important; font-size: 16px; box-shadow: 0 0 0 1px rgba(0,0,0,0.08); outline: none; } .free-guide-cta1 .hbspt-form input.hs-input[type=”email”]:focus { box-shadow: 0 0 0 2px rgba(0, 180, 90, 0.5); } /* === SUBMIT BUTTON === */ .free-guide-cta1 .hbspt-form .hs_submit .hs-button { height: 48px; border-radius: 6px !important; padding: 0 24px !important; border: none !important; background: #00b65c !important; color: #fff !important; font-size: 16px !important; font-weight: 600 !important; cursor: pointer; white-space: nowrap; } .free-guide-cta1 .hbspt-form .hs_submit .hs-button:hover { background: #00a251 !important; } /* Make HubSpot thank-you message text white */ .free-guide-cta1 .hbspt-form .submitted-message { color: #ffffff !important; } .free-guide-cta1 .hbspt-form .submitted-message a { color: #fcb817 !important; } .free-guide-cta1 .hbspt-form .submitted-message span { color: #ffffff !important; font-size: 18px; text-align: center; display: block; } /* === TABLET RESPONSIVE === */ @media (max-width: 900px) { .free-guide-cta1 { padding: 25px; } .free-guide-cta1-container { gap: 20px; } .free-guide-cta1-image { max-width: 140px; } .free-guide-cta1 h2 { font-size: 20px; } .free-guide-cta1 h2 span { font-size: 26px; } } /* === MOBILE RESPONSIVE === */ @media (max-width: 600px) { .free-guide-cta1 { padding: 20px; } .free-guide-cta1-container { flex-direction: column; text-align: center; gap: 20px; } .free-guide-cta1-image { max-width: 160px; margin: 0 auto; } .free-guide-cta1 h2 { text-align: center; font-size: 19px; } .free-guide-cta1 h2 span { font-size: 24px; } .free-guide-cta1 .hbspt-form form.hs-form { flex-wrap: wrap; } .free-guide-cta1 .hbspt-form .hs_submit { width: 100%; } .free-guide-cta1 .hbspt-form .hs_submit .hs-button { width: 100%; text-align: center; } }
What Happened in 1971? The guide that explains the moment our financial system changed.
hbspt.forms.create({ portalId: “49485195”, formId: “31083323-628e-436d-8c87-865262e201b1”, region: “na1” }); Did You Know Gold Trades $361 Billion Per Day?
Most investors think of gold as a safe-haven asset. Fewer realize it’s one of the most actively traded markets on earth.
Gold averaged $361 billion in daily trading volume across global financial markets in 2025. That rivals the daily volume of 10-year U.S. Treasuries — the global benchmark for market liquidity. That’s not a rounding error. That’s a peer comparison.
The liquidity case doesn’t stop at volume. Gold’s daily volatility runs equal to or below that of 30-year U.S. Treasuries. Its bid-ask spreads stayed narrow even during periods of market stress — the exact conditions where liquidity typically dries up.
Then there’s the structural edge. Gold has no issuer. That means no counterparty credit risk, no default scenario, no central bank decision that can impair its value overnight. It’s one of the only major financial assets that carries no embedded inflation risk either.
The World Gold Council is now making a formal case to regulators: gold should be reclassified as a High Quality Liquid Asset — the same category as government bonds. The volume data, the volatility profile, and the stress-test record all point the same direction. The reclassification argument is harder to dismiss than it used to be.
The Fed Says 2.7%. The OECD Says 4.2%. Someone Is Wrong.
There’s a credibility gap opening between the Federal Reserve and independent forecasters. For anyone tracking gold prices and inflation in 2026, it may be the most important number to come out of March. The OECD is now projecting U.S. inflation at 4.2% for 2026, up sharply from its prior estimate of 2.8%, and well above the Fed’s own projection of 2.7%.
The divergence matters because it puts the Fed’s optimism on the record — at precisely the moment energy prices are proving that optimism wrong. In its baseline forecast, the OECD sees the Fed holding its policy rate flat through 2027, reflecting rising headline inflation, core inflation projected to remain above target, and solid GDP growth.
The organization stopped short of calling for hikes, but its warning was pointed: “Policy adjustment may be needed if there are signs of broader price pressures or weaker labour market conditions.”
For anyone counting on rate cuts to drive the next leg of the gold rally, this forecast resets the timeline — and raises the stakes.
.modern-card { background: #ffffff; border-radius: 12px; border: 1px solid #052d6b; box-shadow: 0 2px 8px rgba(5, 45, 107, 0.08); padding: 20px; width: 100%; margin: 20px auto; transition: transform 0.2s ease, box-shadow 0.2s ease; text-align: center; } .modern-card:hover { transform: translateY(-2px); box-shadow: 0 4px 12px rgba(5, 45, 107, 0.12); } .modern-card-title { color: #052d6b; font-size: 30px; font-weight: 600; margin-bottom: 15px; line-height: 1.3; margin-top: 0; } .modern-card-description { color: #64748b; font-size: 15px; line-height: 1.6; margin-bottom: 24px; } .cta-container { display: flex; gap: 12px; justify-content: center; margin-top: 12px; } .cta-price-wrapper { flex: 0 0 60%; max-width: 60%; } .cta-button-wrapper { flex: 0 0 calc(40% – 12px); max-width: calc(40% – 12px); } #cta-price { width: 100%; height: 70px; min-height: 70px; } .hs-cta-embed { max-width: 100% !important; width: 100% !important; height: 70px !important; min-height: 70px !important; margin: 0 !important; padding-top: 13px; } } .hs-cta-embed a { height: 70px !important; min-height: 70px !important; } .hs-cta-embed img { height: 70px !important; min-height: 70px !important; } /* Responsive */ @media (max-width: 768px) { .modern-card { padding: 15px 10px 5px 10px; } .modern-card-title { font-size: 20px; line-height:30px; margin-bottom:0px; } .cta-container { flex-direction: column; gap: 10px; } .cta-price-wrapper, .cta-button-wrapper { flex: 0 0 100%; max-width: 100%; } .hs-cta-embed { padding-top: 5px; } }
Investing in Physical Metals Made Easy
(function(){ var t = document.getElementsByTagName(‘script’)[0]; var s = document.createElement(‘script’); s.async = true; s.src = ‘https://widget.nfusionsolutions.com/widget/script/ticker/1/ca5cd305-1d29-4399-94c0-e50cc5d6f780/6613c4d7-d552-40f5-b5c8-02d5607a400d/cta-price?symbols=gold,silver,gold/silver¤cy=usd&unitofmeasure=toz’; t.parentNode.insertBefore(s, t); })();
Sources: The Mirror · Bloomberg · CNBC · Bloomberg · HQLA Gold · CNBC
You May Also Like
- Gold Bounces as Iran, the Fed, and the Dollar Collide
- Iran Rejects Talks as Gold and Silver Extend Slide
- Is Gold Still a Safe Haven During War?
- Gold Safe Haven Bid Returns After Nine-Day Selloff
- Gold Price Correction Settles as Saudi Arabia Eyes Iran War
- What’s Driving Gold’s Sharpest Pullback of the Year
The post Gold Is Down 14% in March. Inflation Isn’t Done Yet. appeared first on GoldSilver.
What This Means for Investors
For those tracking precious metal markets, this development is particularly important. Gold and silver have historically served as safe-haven assets during times of economic uncertainty. Keeping an eye on these trends can help you make more informed investment decisions.
Final Thoughts
Staying informed about gold and silver price movements is crucial for both traders and long-term investors. We recommend checking our live gold price page for real-time updates and setting up price alerts to never miss a major movement.